[ 00 ] // Deployment record

Reality is the final judge.

Reality is the final judge.

These are real systems built for real organizations facing real operational challenges. Some are public. Others remain confidential. All represent engineering delivered beyond the whiteboard.

These are real systems built for real organizations facing real operational challenges. Some are public. Others remain confidential. All represent engineering delivered beyond the whiteboard.

These are real systems built for real organizations facing real operational challenges. Some are public. Others remain confidential. All represent engineering delivered beyond the whiteboard.

Engineering domains

Engineering domains

Energy / Water / Agriculture / Food / Forests / Mining / Natural Capital / Government / Defense / Industrial Operations / Climate / Transport

[ 01 ] // Climate resilience

Iberdrola: grid resilience to extreme weather

Iberdrola: grid resilience to extreme weather

Iberdrola asked how to protect 1.1M km of line from the climate. We won the challenge. The forecasts existed; the decision did not. Between a weather model and a crew dispatched to the right tower there was nothing but human judgement under time pressure.

Client

Iberdrola

Iberdrola

Type

Deployment

Deployment

Sector

Energy / Transmission

Energy / Transmission

Region

Spain

Spain

Live since

2023

2023

High-voltage transmission lines crossing open terrain

Transmission corridor. Photograph for reference only.

The problem

Extreme weather moves faster than crews can be positioned. The forecasts existed; what was missing was the step that turned them into where to send people and what to do first. Across 1.1M km of line, that decision was made event by event, in real time.

The system

A resilience layer built on the Engine: asset models, high-resolution weather, and a failure-probability model per span, resolved to the map the control room already uses. Risk arrives inside the existing workflow, ready to act on before the storm.

The outcome

The operator now pre-positions crews and de-energizes selectively before the event, not after. Response to climate events is 73% faster, restoration windows shortened.

Operating map view of the monitored corridor

73%

faster response

1.1M km

of predictive coverage

2023

Iberdrola PERSEO winner

[ 02 ] // FORESTRY LIVING SYSTEM

Hazi / Basodata: the whole forest, as one system

Hazi / Basodata: the whole forest, as one system

Hazi is one of the most advanced forestry organizations in the world, and it set out to manage every forest in the Basque Country as a single system. The data existed; the shared representation did not. It lived across agencies, landowners, and satellites that had never been brought into one language. Hazi decided to close that gap.

Client

Hazi

Hazi

Type

Deployment

Deployment

Sector

Public sector / Forestry

Public sector / Forestry

Region

Basque Country, Spain

Basque Country, Spain

Live since

2024

2024

Rural land parcels seen from above

Managed woodland under monitoring. Photograph for reference only.

The problem

A forest is administered by many hands at once: agencies, private owners, researchers, each holding its own field data in its own language. Even the best-run organization answers a single question about the territory by assembling it across institutions, every time, over months. Hazi wanted to operate faster than the territory could be read by hand.

A forest is administered by many hands at once: agencies, private owners, researchers, each holding its own field data in its own language. Even the best-run organization answers a single question about the territory by assembling it across institutions, every time, over months. Hazi wanted to operate faster than the territory could be read by hand.

A forest is administered by many hands at once: agencies, private owners, researchers, each holding its own field data in its own language. Even the best-run organization answers a single question about the territory by assembling it across institutions, every time, over months. Hazi wanted to operate faster than the territory could be read by hand.

The system

Basodata: a public forest layer built on the Engine. Satellite observation, terrain and species data, ownership records, and each actor's field data fuse into one representation of every stand in the Basque Country, under a shared ontology. The forest is queried as a single system, and every actor works against the same live state of the territory.

Basodata: a public forest layer built on the Engine. Satellite observation, terrain and species data, ownership records, and each actor's field data fuse into one representation of every stand in the Basque Country, under a shared ontology. The forest is queried as a single system, and every actor works against the same live state of the territory.

Basodata: a public forest layer built on the Engine. Satellite observation, terrain and species data, ownership records, and each actor's field data fuse into one representation of every stand in the Basque Country, under a shared ontology. The forest is queried as a single system, and every actor works against the same live state of the territory.

The outcome

Hazi now manages the region's forest against one live model. Permits, research, and land decisions that depended on manual cross-referencing resolve in [days]. The organization that already set the standard now runs it on a system built for the scale of the whole territory.

Hazi now manages the region's forest against one live model. Permits, research, and land decisions that depended on manual cross-referencing resolve in [days]. The organization that already set the standard now runs it on a system built for the scale of the whole territory.

Hazi now manages the region's forest against one live model. Permits, research, and land decisions that depended on manual cross-referencing resolve in [days]. The organization that already set the standard now runs it on a system built for the scale of the whole territory.

Declaration compliance view

722K ha

of forest under one live model

500+

data sources and actors integrated into one ontology

1 day

Between updates across the whole forest

[ 03 ] // PUBLIC LAND

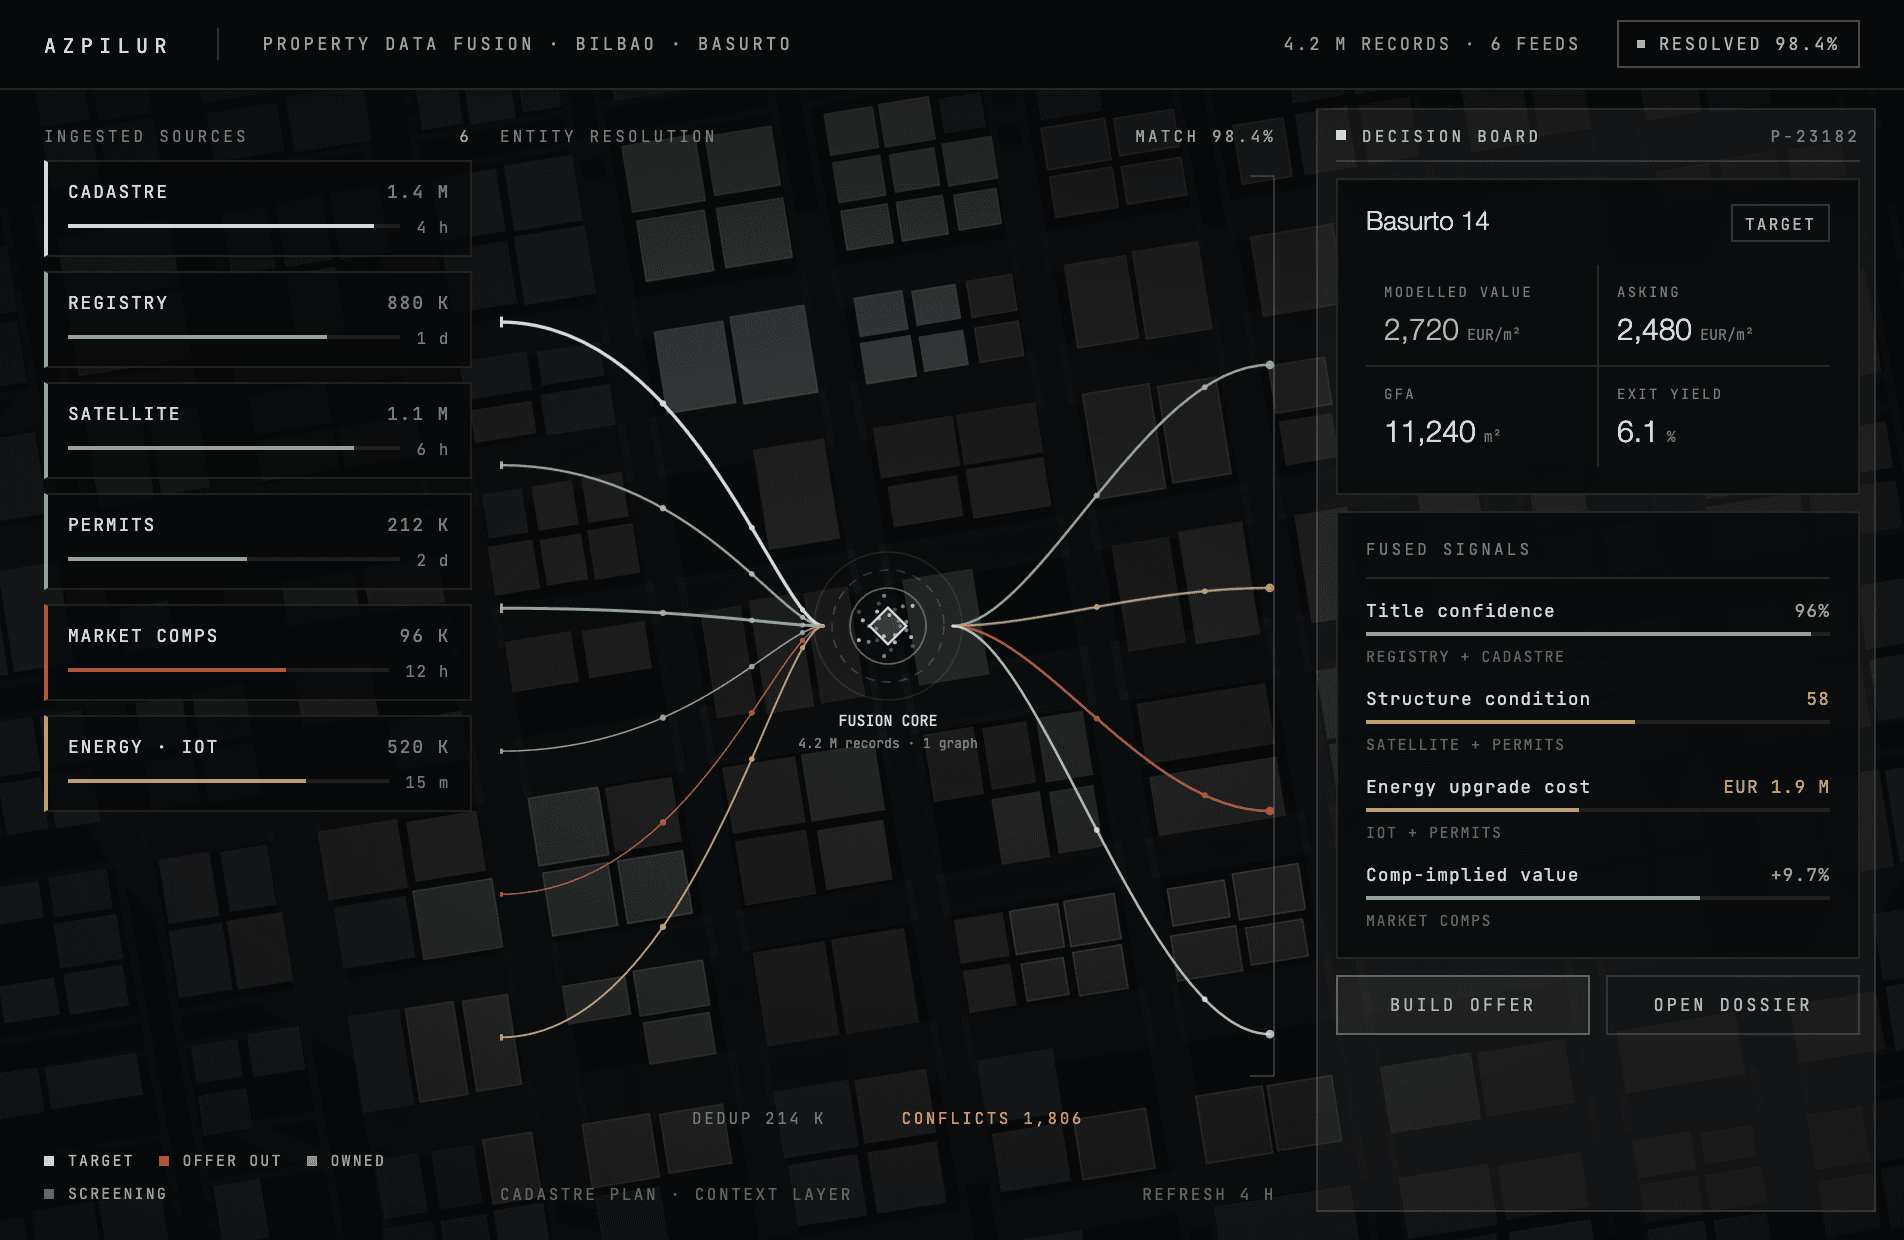
Azpilur: the whole city, as an investable asset

Azpilur: the whole city, as an investable asset

Azpilur had to decide which land to acquire and what it could become. We won the challenge. The data existed; the decision did not. Between a satellite pass and a signed acquisition there was nothing but months of manual analysis, parcel by parcel.

Client

Azpilur

Type

Deployment

Deployment

Sector

Public sector / Urban land

Public sector / Urban land

Region

Basque Country, Spain

Basque Country, Spain

Live since

2025

2025

Water distribution infrastructure

Industrial land under assessment. Photograph for reference only.

The problem

Acquiring and managing public land meant reading the territory by hand. Terrain, environmental condition, development potential, the effect on how people would live there: every dimension analyzed manually, one parcel at a time, before a single euro could be committed. Investment decisions waited on months of fieldwork and cross-referencing, and the picture was outdated by the time it was complete.

Acquiring and managing public land meant reading the territory by hand. Terrain, environmental condition, development potential, the effect on how people would live there: every dimension analyzed manually, one parcel at a time, before a single euro could be committed. Investment decisions waited on months of fieldwork and cross-referencing, and the picture was outdated by the time it was complete.

Acquiring and managing public land meant reading the territory by hand. Terrain, environmental condition, development potential, the effect on how people would live there: every dimension analyzed manually, one parcel at a time, before a single euro could be committed. Investment decisions waited on months of fieldwork and cross-referencing, and the picture was outdated by the time it was complete.

The system

A territorial layer built on the Engine: land observation, environmental and terrain analysis, and development-potential modeling unified into a single representation of the entire city. No fieldwork to commission per decision. The whole territory is live, and the consequence of an acquisition is visible before it is made.

A territorial layer built on the Engine: land observation, environmental and terrain analysis, and development-potential modeling unified into a single representation of the entire city. No fieldwork to commission per decision. The whole territory is live, and the consequence of an acquisition is visible before it is made.

A territorial layer built on the Engine: land observation, environmental and terrain analysis, and development-potential modeling unified into a single representation of the entire city. No fieldwork to commission per decision. The whole territory is live, and the consequence of an acquisition is visible before it is made.

The outcome

Decision-makers now simulate the entire city at a click. Acquisition and development scenarios are tested against the actual state of the land, and only the ones that hold move forward. Analysis that took months resolves in [minutes]. What was manual, parcel-by-parcel judgement is now a model of the territory anyone authorized can act on.

Decision-makers now simulate the entire city at a click. Acquisition and development scenarios are tested against the actual state of the land, and only the ones that hold move forward. Analysis that took months resolves in [minutes]. What was manual, parcel-by-parcel judgement is now a model of the territory anyone authorized can act on.

Decision-makers now simulate the entire city at a click. Acquisition and development scenarios are tested against the actual state of the land, and only the ones that hold move forward. Analysis that took months resolves in [minutes]. What was manual, parcel-by-parcel judgement is now a model of the territory anyone authorized can act on.

Network loss localisation view

Months → [minutes]

for analysis that priced a single acquisition

100%

of the territory under one model

2024

BIND GovTech challenge winner

[ 04 ] // ENERGY Operational intelligence

Predicterra: physical risk, visible before it happens

Predicterra: physical risk, visible before it happens

Energy runs on physics, not on code. A grid fails because of weather, an asset because of the ground it sits on. The forecasts existed; what was missing was the step that turns them into a decision on a specific asset. Predicterra is that step, built on the Engine and running inside Europe's largest energy operators.

Client

Predicterra

Predicterra

Type

Builder

Builder

Sector

Energy

Energy

Region

Global

Global

Live since

2025

2025

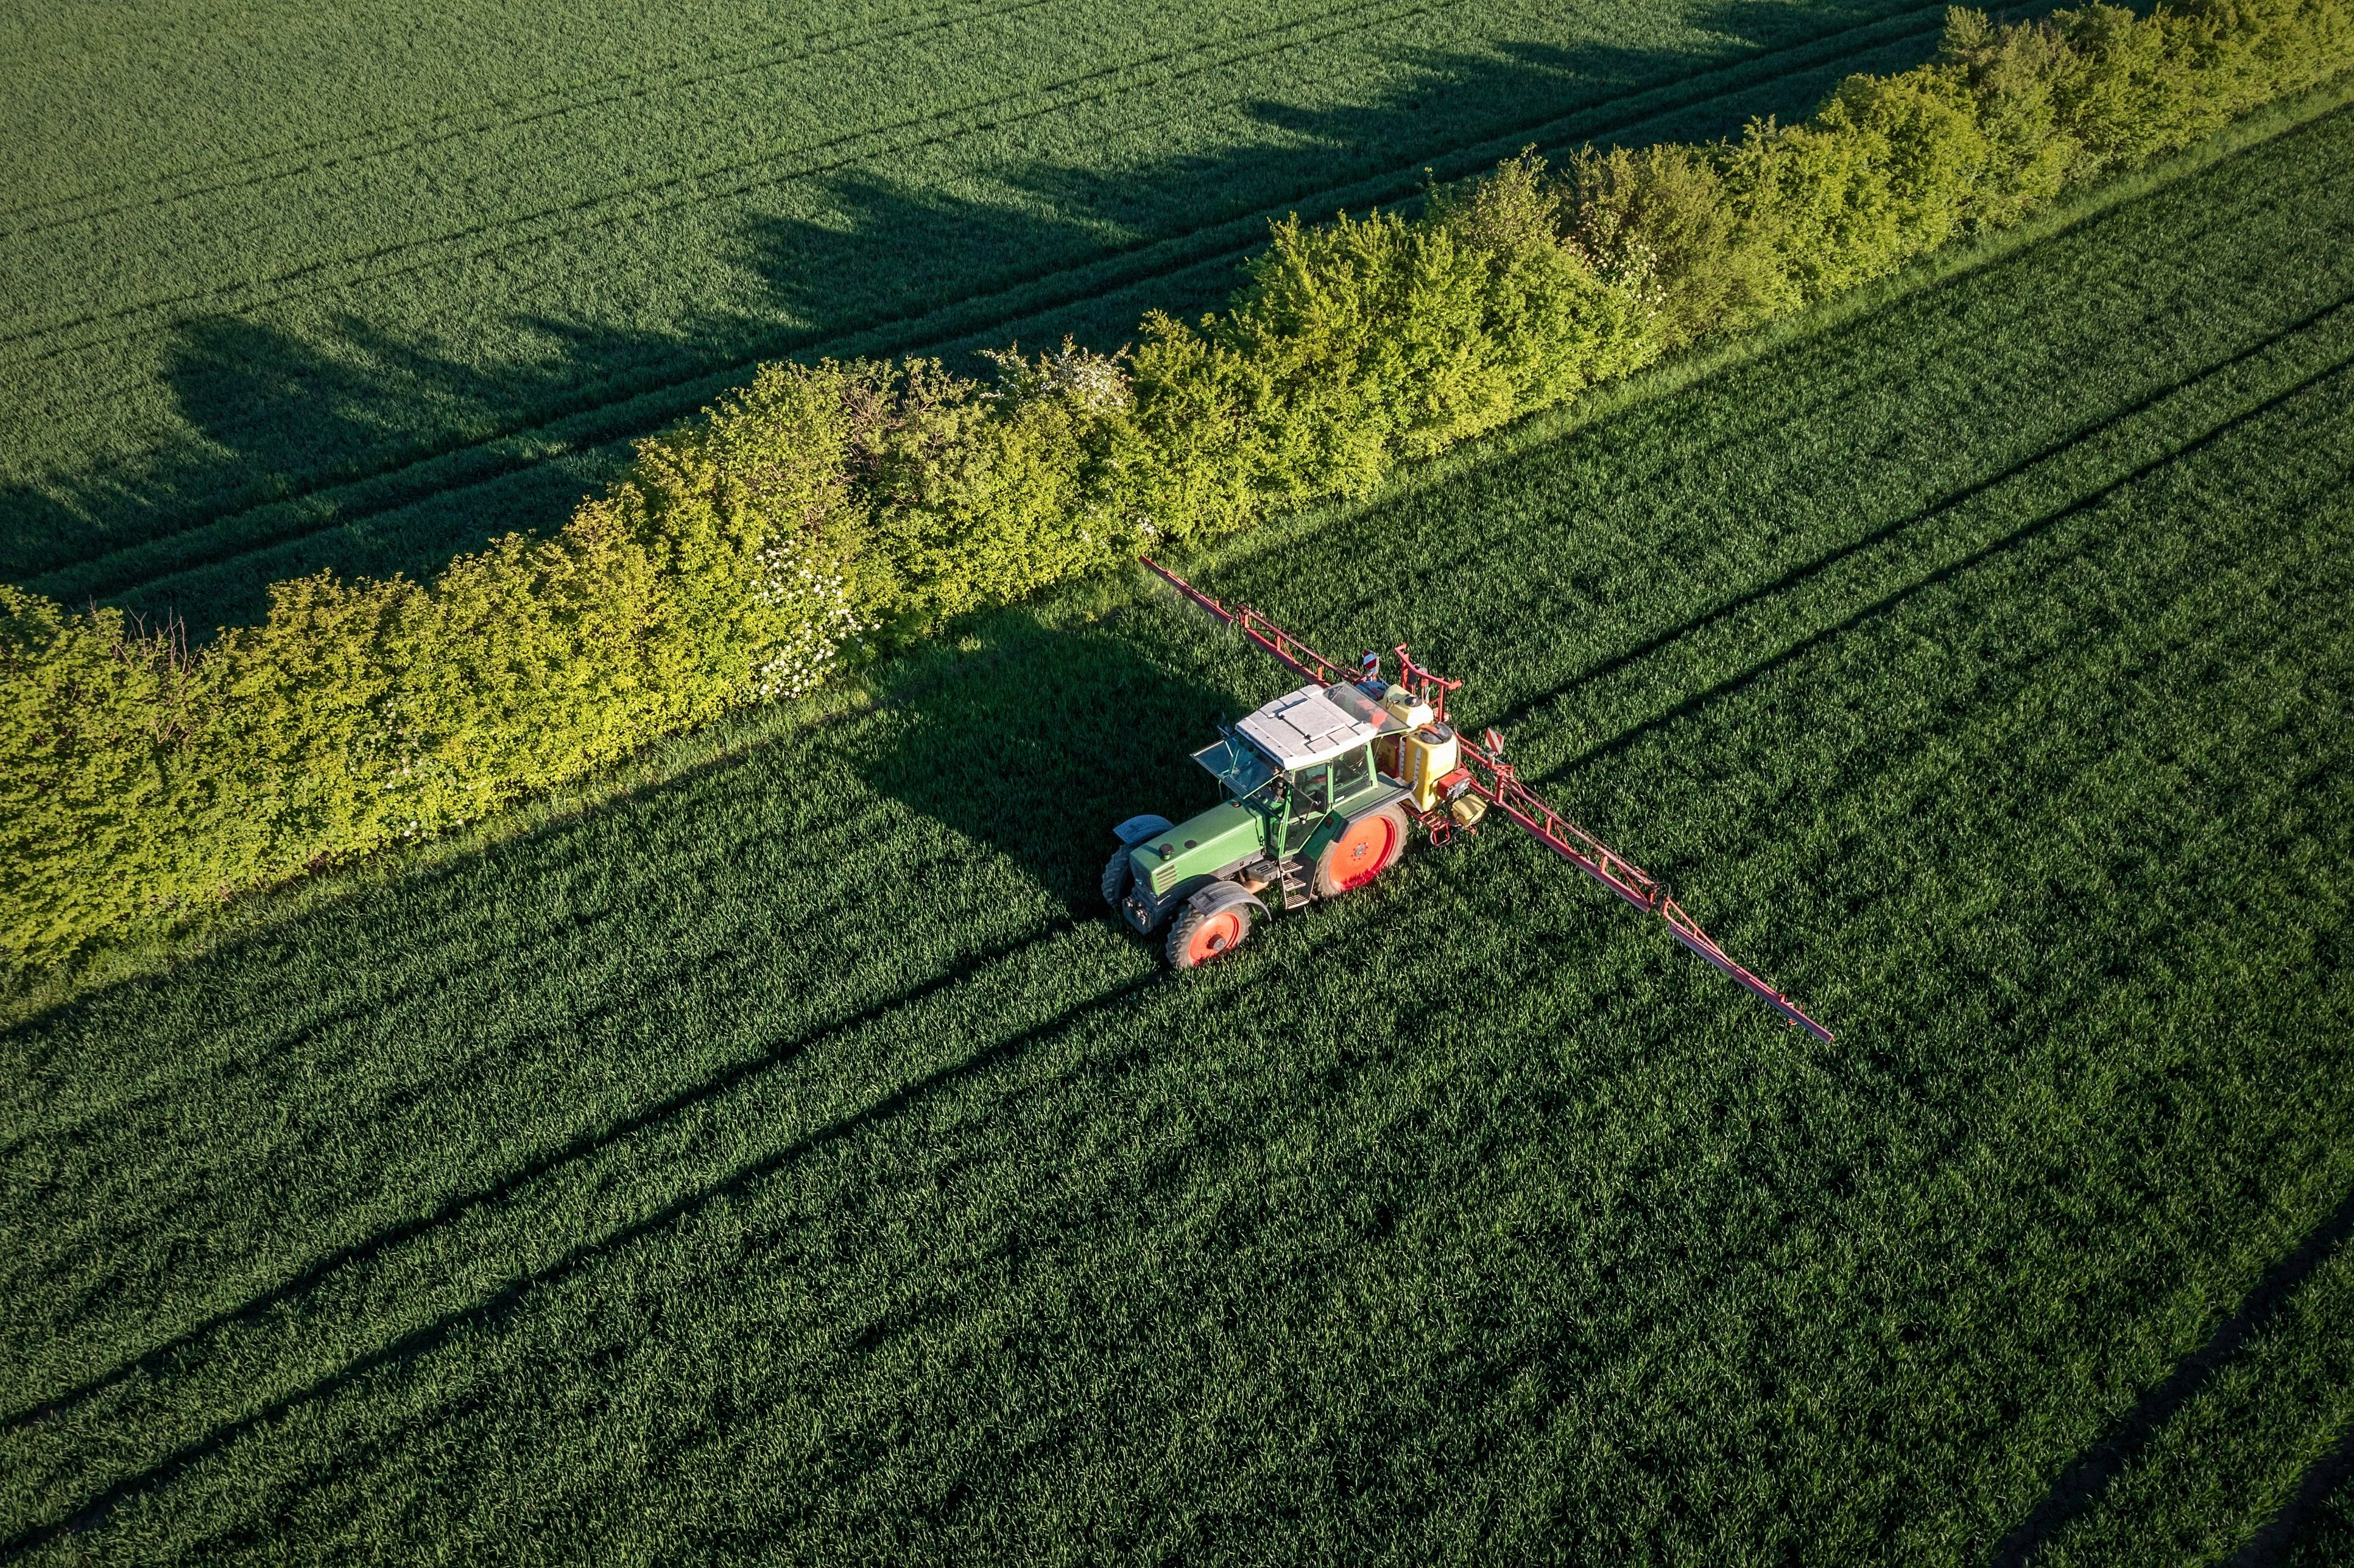
Aerial view of cultivated land

Energy infrastructure under monitoring. Photograph for reference only.

The problem

Climate-driven risk reaches physical assets faster than operations can respond. Weather, wildfire, flood, and terrain data all exist, but each lives in its own system and its own language. Turning them into one answer about which asset is exposed, when, and what to do first has meant assembling the picture by hand, per event, across an entire footprint.

Climate-driven risk reaches physical assets faster than operations can respond. Weather, wildfire, flood, and terrain data all exist, but each lives in its own system and its own language. Turning them into one answer about which asset is exposed, when, and what to do first has meant assembling the picture by hand, per event, across an entire footprint.

Climate-driven risk reaches physical assets faster than operations can respond. Weather, wildfire, flood, and terrain data all exist, but each lives in its own system and its own language. Turning them into one answer about which asset is exposed, when, and what to do first has meant assembling the picture by hand, per event, across an entire footprint.

The system

Predicterra fuses high-resolution weather, Earth observation, terrain, and asset data into one risk surface, resolved to the individual asset and the decision. It runs on the Engine, so it never starts from a blank page. Certified on Microsoft Azure Marketplace, it operates inside the workflows an operator already uses, not as a dashboard on top of them.

Predicterra fuses high-resolution weather, Earth observation, terrain, and asset data into one risk surface, resolved to the individual asset and the decision. It runs on the Engine, so it never starts from a blank page. Certified on Microsoft Azure Marketplace, it operates inside the workflows an operator already uses, not as a dashboard on top of them.

Predicterra fuses high-resolution weather, Earth observation, terrain, and asset data into one risk surface, resolved to the individual asset and the decision. It runs on the Engine, so it never starts from a blank page. Certified on Microsoft Azure Marketplace, it operates inside the workflows an operator already uses, not as a dashboard on top of them.

The outcome

Operators now act on physical risk before an event arrives. Crews are pre-positioned, maintenance and capital planning run against forward-looking risk, and the same layer extends to new assets and regions without rebuilding the model. What was reactive is now anticipatory, at the scale of the networks that power a continent.

Operators now act on physical risk before an event arrives. Crews are pre-positioned, maintenance and capital planning run against forward-looking risk, and the same layer extends to new assets and regions without rebuilding the model. What was reactive is now anticipatory, at the scale of the networks that power a continent.

Operators now act on physical risk before an event arrives. Crews are pre-positioned, maintenance and capital planning run against forward-looking risk, and the same layer extends to new assets and regions without rebuilding the model. What was reactive is now anticipatory, at the scale of the networks that power a continent.

Per-parcel condition dashboard

€2.1M/year

In avoided outage costs by turning risk into action sooner.

Azure Marketplace

published and validated on Microsoft Azure Marketplace

3

energy operators running on Predicterra

[ 05 ] // Sustainability & compliance

Woza and Google: joining forces for a resilient physical world

Woza and Google: joining forces for a resilient physical world

Storms, heat and shifting terrain now hit the assets companies depend on. Google and Woza join forces to change that: planetary-scale data meeting physical-world intelligence, so businesses see risk coming and act before it lands.

alliance

Google + Woza

Google + Woza

Type

Collaboration

Collaboration

Sector

Energy / Agri-food / Public sector

Energy / Agri-food / Public sector

Region

Global

Global

Live since

2023

2023

Forest canopy from above

Technology for the physical world. Illustrative.

The problem

Companies plan on paper but operate in the physical world, where climate now moves faster than their tools. Assets, land and supply chains are exposed, and nothing reads the ground at the speed decisions demand.

Companies plan on paper but operate in the physical world, where climate now moves faster than their tools. Assets, land and supply chains are exposed, and nothing reads the ground at the speed decisions demand.

Companies plan on paper but operate in the physical world, where climate now moves faster than their tools. Assets, land and supply chains are exposed, and nothing reads the ground at the speed decisions demand.

The system

Two strengths, stronger together. Google brings planetary-scale compute and Earth observation; Woza turns that signal into decisions resolved to a place: flood, wildfire, and asset risk. A stack for the physical world, not a dashboard on top of it.

Two strengths, stronger together. Google brings planetary-scale compute and Earth observation; Woza turns that signal into decisions resolved to a place: flood, wildfire, and asset risk. A stack for the physical world, not a dashboard on top of it.

Two strengths, stronger together. Google brings planetary-scale compute and Earth observation; Woza turns that signal into decisions resolved to a place: flood, wildfire, and asset risk. A stack for the physical world, not a dashboard on top of it.

The outcome

Energy operators, farms and governments now see environmental risk before it arrives, and act while there is still time. Two forces, one purpose: companies resilient enough to keep running through whatever the physical world throws at them.

Energy operators, farms and governments now see environmental risk before it arrives, and act while there is still time. Two forces, one purpose: companies resilient enough to keep running through whatever the physical world throws at them.

Energy operators, farms and governments now see environmental risk before it arrives, and act while there is still time. Two forces, one purpose: companies resilient enough to keep running through whatever the physical world throws at them.

Continental structure model output

One stack

Google's planetary scale meets Woza's physical-world intelligence.

Physical world

Risk resolved to real assets, land and infrastructure.

Resilience

Companies act before the event, not after it.

[ 06 ] // agtech infrastructure

Agrology: data fusion as the foundation

Agrology: data fusion as the foundation

Agrology set out to operate at the speed its market moved, not the speed its data allowed. Every agtech hits the same wall: the intelligence is real, but it's scattered across sources that don't fuse. Agrology chose not to build that layer itself. It ran on the Engine instead.

Client

Agrology

Agrology

Type

Deployment / Engine embedded

Deployment / Engine embedded

Sector

Agriculture

Agriculture

Region

LATAM / Iberia

LATAM / Iberia

Live since

2025

2025

Cultivated terrain seen from the air

Cultivated land under monitoring. Photograph for reference only.

The problem

An agtech is only as fast as the layer beneath it. Satellite imagery, weather, soil, agronomic records, sustainability signals, and each user's own data live in separate systems, formats, and clocks. Fusing them into one coherent state, per field and per user, is a foundational problem most agtechs spend years rebuilding instead of solving once.

An agtech is only as fast as the layer beneath it. Satellite imagery, weather, soil, agronomic records, sustainability signals, and each user's own data live in separate systems, formats, and clocks. Fusing them into one coherent state, per field and per user, is a foundational problem most agtechs spend years rebuilding instead of solving once.

An agtech is only as fast as the layer beneath it. Satellite imagery, weather, soil, agronomic records, sustainability signals, and each user's own data live in separate systems, formats, and clocks. Fusing them into one coherent state, per field and per user, is a foundational problem most agtechs spend years rebuilding instead of solving once.

The system

Woza built the engine beneath Agrology's platform: a unified layer that fuses Earth observation, climate, terrain, agronomic, and user data into one representation of every field. Crop-behavior prediction, sustainability validation, and operational intelligence run on one substrate, not five pipelines stitched together. It never starts from a blank page.

Woza built the engine beneath Agrology's platform: a unified layer that fuses Earth observation, climate, terrain, agronomic, and user data into one representation of every field. Crop-behavior prediction, sustainability validation, and operational intelligence run on one substrate, not five pipelines stitched together. It never starts from a blank page.

Woza built the engine beneath Agrology's platform: a unified layer that fuses Earth observation, climate, terrain, agronomic, and user data into one representation of every field. Crop-behavior prediction, sustainability validation, and operational intelligence run on one substrate, not five pipelines stitched together. It never starts from a blank page.

The outcome

Agrology operates at the speed of a single system. Sustainability checks that meant manual audits validate against live field data. Crop behavior is predicted per parcel, not estimated per region. New capabilities ship on the same engine without rebuilding the data for each.

Agrology operates at the speed of a single system. Sustainability checks that meant manual audits validate against live field data. Crop behavior is predicted per parcel, not estimated per region. New capabilities ship on the same engine without rebuilding the data for each.

Agrology operates at the speed of a single system. Sustainability checks that meant manual audits validate against live field data. Crop behavior is predicted per parcel, not estimated per region. New capabilities ship on the same engine without rebuilding the data for each.

Block-level risk map

30M ha

monitored under one engine

2x

faster crop classification

One

engine beneath the entire platform

[ 07 ] // grid resilience

Naturgy / UFD: the grid, ahead of the weather

Naturgy / UFD: the grid, ahead of the weather

UFD distributes power to 3.8M supply points across 116,000 km of line, over terrain and climate that change every few kilometers. The forecasts existed; the step that turned them into where to send crews, on which asset, before the storm, did not. Predicterra is that step.

Client

UFD · Grupo Naturgy

UFD · Grupo Naturgy

Type

Research & Deployment

Research & Deployment

Sector

Energy

Energy

Region

Spain

Spain

Live since

2025

2025

Open land seen from the air

Distribution network under monitoring. Photograph for reference only.

The problem

Extreme weather reaches the network faster than crews can be positioned, and each event lands differently by terrain and vegetation. Weather, satellite, terrain, and incident history all exist, each in its own system. Turning them into one answer about which line is exposed, when, and what to do first has meant reading the territory by hand, per event, across 116,000 km.

Extreme weather reaches the network faster than crews can be positioned, and each event lands differently by terrain and vegetation. Weather, satellite, terrain, and incident history all exist, each in its own system. Turning them into one answer about which line is exposed, when, and what to do first has meant reading the territory by hand, per event, across 116,000 km.

Extreme weather reaches the network faster than crews can be positioned, and each event lands differently by terrain and vegetation. Weather, satellite, terrain, and incident history all exist, each in its own system. Turning them into one answer about which line is exposed, when, and what to do first has meant reading the territory by hand, per event, across 116,000 km.

The system

Predicterra unifies UFD's assets and a physical model of the territory under one ontology, then correlates weather, satellite, terrain, and vegetation data to explain why each asset is exposed, not just flag it. Risk forecasts run from hours to 14 days, resolved to specific lines and assets, and the model learns from every incident UFD records. Risk arrives inside the operating map the control room already uses.

Predicterra unifies UFD's assets and a physical model of the territory under one ontology, then correlates weather, satellite, terrain, and vegetation data to explain why each asset is exposed, not just flag it. Risk forecasts run from hours to 14 days, resolved to specific lines and assets, and the model learns from every incident UFD records. Risk arrives inside the operating map the control room already uses.

Predicterra unifies UFD's assets and a physical model of the territory under one ontology, then correlates weather, satellite, terrain, and vegetation data to explain why each asset is exposed, not just flag it. Risk forecasts run from hours to 14 days, resolved to specific lines and assets, and the model learns from every incident UFD records. Risk arrives inside the operating map the control room already uses.

The outcome

UFD pre-positions and sizes repair crews against forward-looking risk, before events arrive. The same model simulates scenarios across the whole territory, out to decades, turning grid planning from reactive to anticipatory. Validated over ten years of incident history in the pilot zones, it cleanly separated the lines that failed from the ones that didn't.

UFD pre-positions and sizes repair crews against forward-looking risk, before events arrive. The same model simulates scenarios across the whole territory, out to decades, turning grid planning from reactive to anticipatory. Validated over ten years of incident history in the pilot zones, it cleanly separated the lines that failed from the ones that didn't.

UFD pre-positions and sizes repair crews against forward-looking risk, before events arrive. The same model simulates scenarios across the whole territory, out to decades, turning grid planning from reactive to anticipatory. Validated over ten years of incident history in the pilot zones, it cleanly separated the lines that failed from the ones that didn't.

Scored parcel profile

3.8M

supply points served across the network

116,000 km

of distribution line under one model

14 days

of asset-level risk, from hours to two weeks ahead

[ 08 ] // agtech infrastructure

SIMA: market and field,
one system

SIMA: market and field,
one system

SIMA Earth was already a leader in Latin American agriculture. It didn't need a platform; it needed a deeper layer beneath the one it had. Crop health, climate, and market signal lived in sources that never fused. SIMA chose to run on the Engine rather than rebuild that layer itself.

Client

SIMA Earth

SIMA Earth

Type

Deployment / Engine embedded

Deployment / Engine embedded

Sector

Agriculture

Agriculture

Region

Brazil / Argentina

Brazil / Argentina

Live since

2024

2024

Industrial facility at dusk

Cultivated land under monitoring. Photograph for reference only.

The problem

Agriculture at scale trades resolution for reach. Crop health is slow to read across vast landscapes, climate variability demands forecasting most platforms can't produce, and the market signal farmers decide on lives apart from the field data. Fusing satellite, weather, field, and market sources into one answer costs an agtech years to build from scratch.

Agriculture at scale trades resolution for reach. Crop health is slow to read across vast landscapes, climate variability demands forecasting most platforms can't produce, and the market signal farmers decide on lives apart from the field data. Fusing satellite, weather, field, and market sources into one answer costs an agtech years to build from scratch.

Agriculture at scale trades resolution for reach. Crop health is slow to read across vast landscapes, climate variability demands forecasting most platforms can't produce, and the market signal farmers decide on lives apart from the field data. Fusing satellite, weather, field, and market sources into one answer costs an agtech years to build from scratch.

The system

SIMA Earth runs on the Engine. Satellite observation, climate, field data, and market signal fuse into one representation of every operation, resolved to the crop and the decision. Crop-health monitoring, climate adaptation, and commercial intelligence run on one substrate, not separate pipelines stitched together. SIMA's product runs in front of its users; the Engine runs underneath.

SIMA Earth runs on the Engine. Satellite observation, climate, field data, and market signal fuse into one representation of every operation, resolved to the crop and the decision. Crop-health monitoring, climate adaptation, and commercial intelligence run on one substrate, not separate pipelines stitched together. SIMA's product runs in front of its users; the Engine runs underneath.

SIMA Earth runs on the Engine. Satellite observation, climate, field data, and market signal fuse into one representation of every operation, resolved to the crop and the decision. Crop-health monitoring, climate adaptation, and commercial intelligence run on one substrate, not separate pipelines stitched together. SIMA's product runs in front of its users; the Engine runs underneath.

The outcome

SIMA Earth serves its users at the speed of a single system. Crop health is monitored continuously, not audited late. Farmers act on market and field signal from one surface, and decisions that waited on manual data assembly resolve against one live model. The agtech that already led its market now runs on a layer built for the whole region.

SIMA Earth serves its users at the speed of a single system. Crop health is monitored continuously, not audited late. Farmers act on market and field signal from one surface, and decisions that waited on manual data assembly resolve against one live model. The agtech that already led its market now runs on a layer built for the whole region.

SIMA Earth serves its users at the speed of a single system. Crop health is monitored continuously, not audited late. Farmers act on market and field signal from one surface, and decisions that waited on manual data assembly resolve against one live model. The agtech that already led its market now runs on a layer built for the whole region.

Per-line water intensity view

80M ha

under continuous monitoring

One

engine beneath the platform

7x

faster from field data to decision

[ 09 ] // forest intelligence infrastructure

AboveForest: the operating
system for Earth's forests

AboveForest: the operating
system for Earth's forests

The most critical ecosystem on the planet is still governed by field visits, static reports, and inventories a decade old. The data to manage a forest as a system exists, scattered across satellites that never fuse. AboveForest turns every forest into one navigable model, at planetary scale.

Client

Aboveforest

Aboveforest

Type

System

System

Sector

Forestry / Land and climate

Forestry / Land and climate

Region

Global

Global

Live since

2025 / Early dev

2025 / Early dev

Dense forest canopy from above

Managed forest under monitoring. Photograph for reference only.

The problem

A forest is administered by many hands with data that never meets. Less than 1% of the world's forests are inventoried tree by tree, national inventories lag 5 to 10 years, and under 16% of carbon projects are real and verifiable. The largest terrestrial system on Earth is governed on estimates. The problem was never observation. It was that observation never became one operable model.

A forest is administered by many hands with data that never meets. Less than 1% of the world's forests are inventoried tree by tree, national inventories lag 5 to 10 years, and under 16% of carbon projects are real and verifiable. The largest terrestrial system on Earth is governed on estimates. The problem was never observation. It was that observation never became one operable model.

A forest is administered by many hands with data that never meets. Less than 1% of the world's forests are inventoried tree by tree, national inventories lag 5 to 10 years, and under 16% of carbon projects are real and verifiable. The largest terrestrial system on Earth is governed on estimates. The problem was never observation. It was that observation never became one operable model.

The system

AboveForest fuses satellite, LiDAR, radar, and field data into one representation of every forest, resolved to the individual tree: species, height, diameter, health. Sentinel, Landsat, GEDI, and NASA and ESA pipelines feed one coherent layer under the ForestLayer ontology. Wildfire, carbon stock, pest stress, and CSRD, EUDR, and REDD+ compliance run on the same model.

AboveForest fuses satellite, LiDAR, radar, and field data into one representation of every forest, resolved to the individual tree: species, height, diameter, health. Sentinel, Landsat, GEDI, and NASA and ESA pipelines feed one coherent layer under the ForestLayer ontology. Wildfire, carbon stock, pest stress, and CSRD, EUDR, and REDD+ compliance run on the same model.

AboveForest fuses satellite, LiDAR, radar, and field data into one representation of every forest, resolved to the individual tree: species, height, diameter, health. Sentinel, Landsat, GEDI, and NASA and ESA pipelines feed one coherent layer under the ForestLayer ontology. Wildfire, carbon stock, pest stress, and CSRD, EUDR, and REDD+ compliance run on the same model.

The outcome

A forest is queried, planned, and governed as one live system, updated in days, not once a decade. Carbon comes from tree-level biometrics, not tables. Wildfire is simulated on real 3D structure before it becomes an emergency. Deforestation is caught in near real time, and every hand works against the same ground truth.

A forest is queried, planned, and governed as one live system, updated in days, not once a decade. Carbon comes from tree-level biometrics, not tables. Wildfire is simulated on real 3D structure before it becomes an emergency. Deforestation is caught in near real time, and every hand works against the same ground truth.

A forest is queried, planned, and governed as one live system, updated in days, not once a decade. Carbon comes from tree-level biometrics, not tables. Wildfire is simulated on real 3D structure before it becomes an emergency. Deforestation is caught in near real time, and every hand works against the same ground truth.

Biomass model output over a measured stand

<1%

of the world's forests inventoried tree by tree, until now

47M ha

in the deployment pipeline across 9 countries

Days

between updates, where inventories once took a decade

[ 10 ] // urban climate infrastucture

Basque Energy Entity: cutting
CO2 from urban traffic

Basque Energy Entity: cutting
CO2 from urban traffic

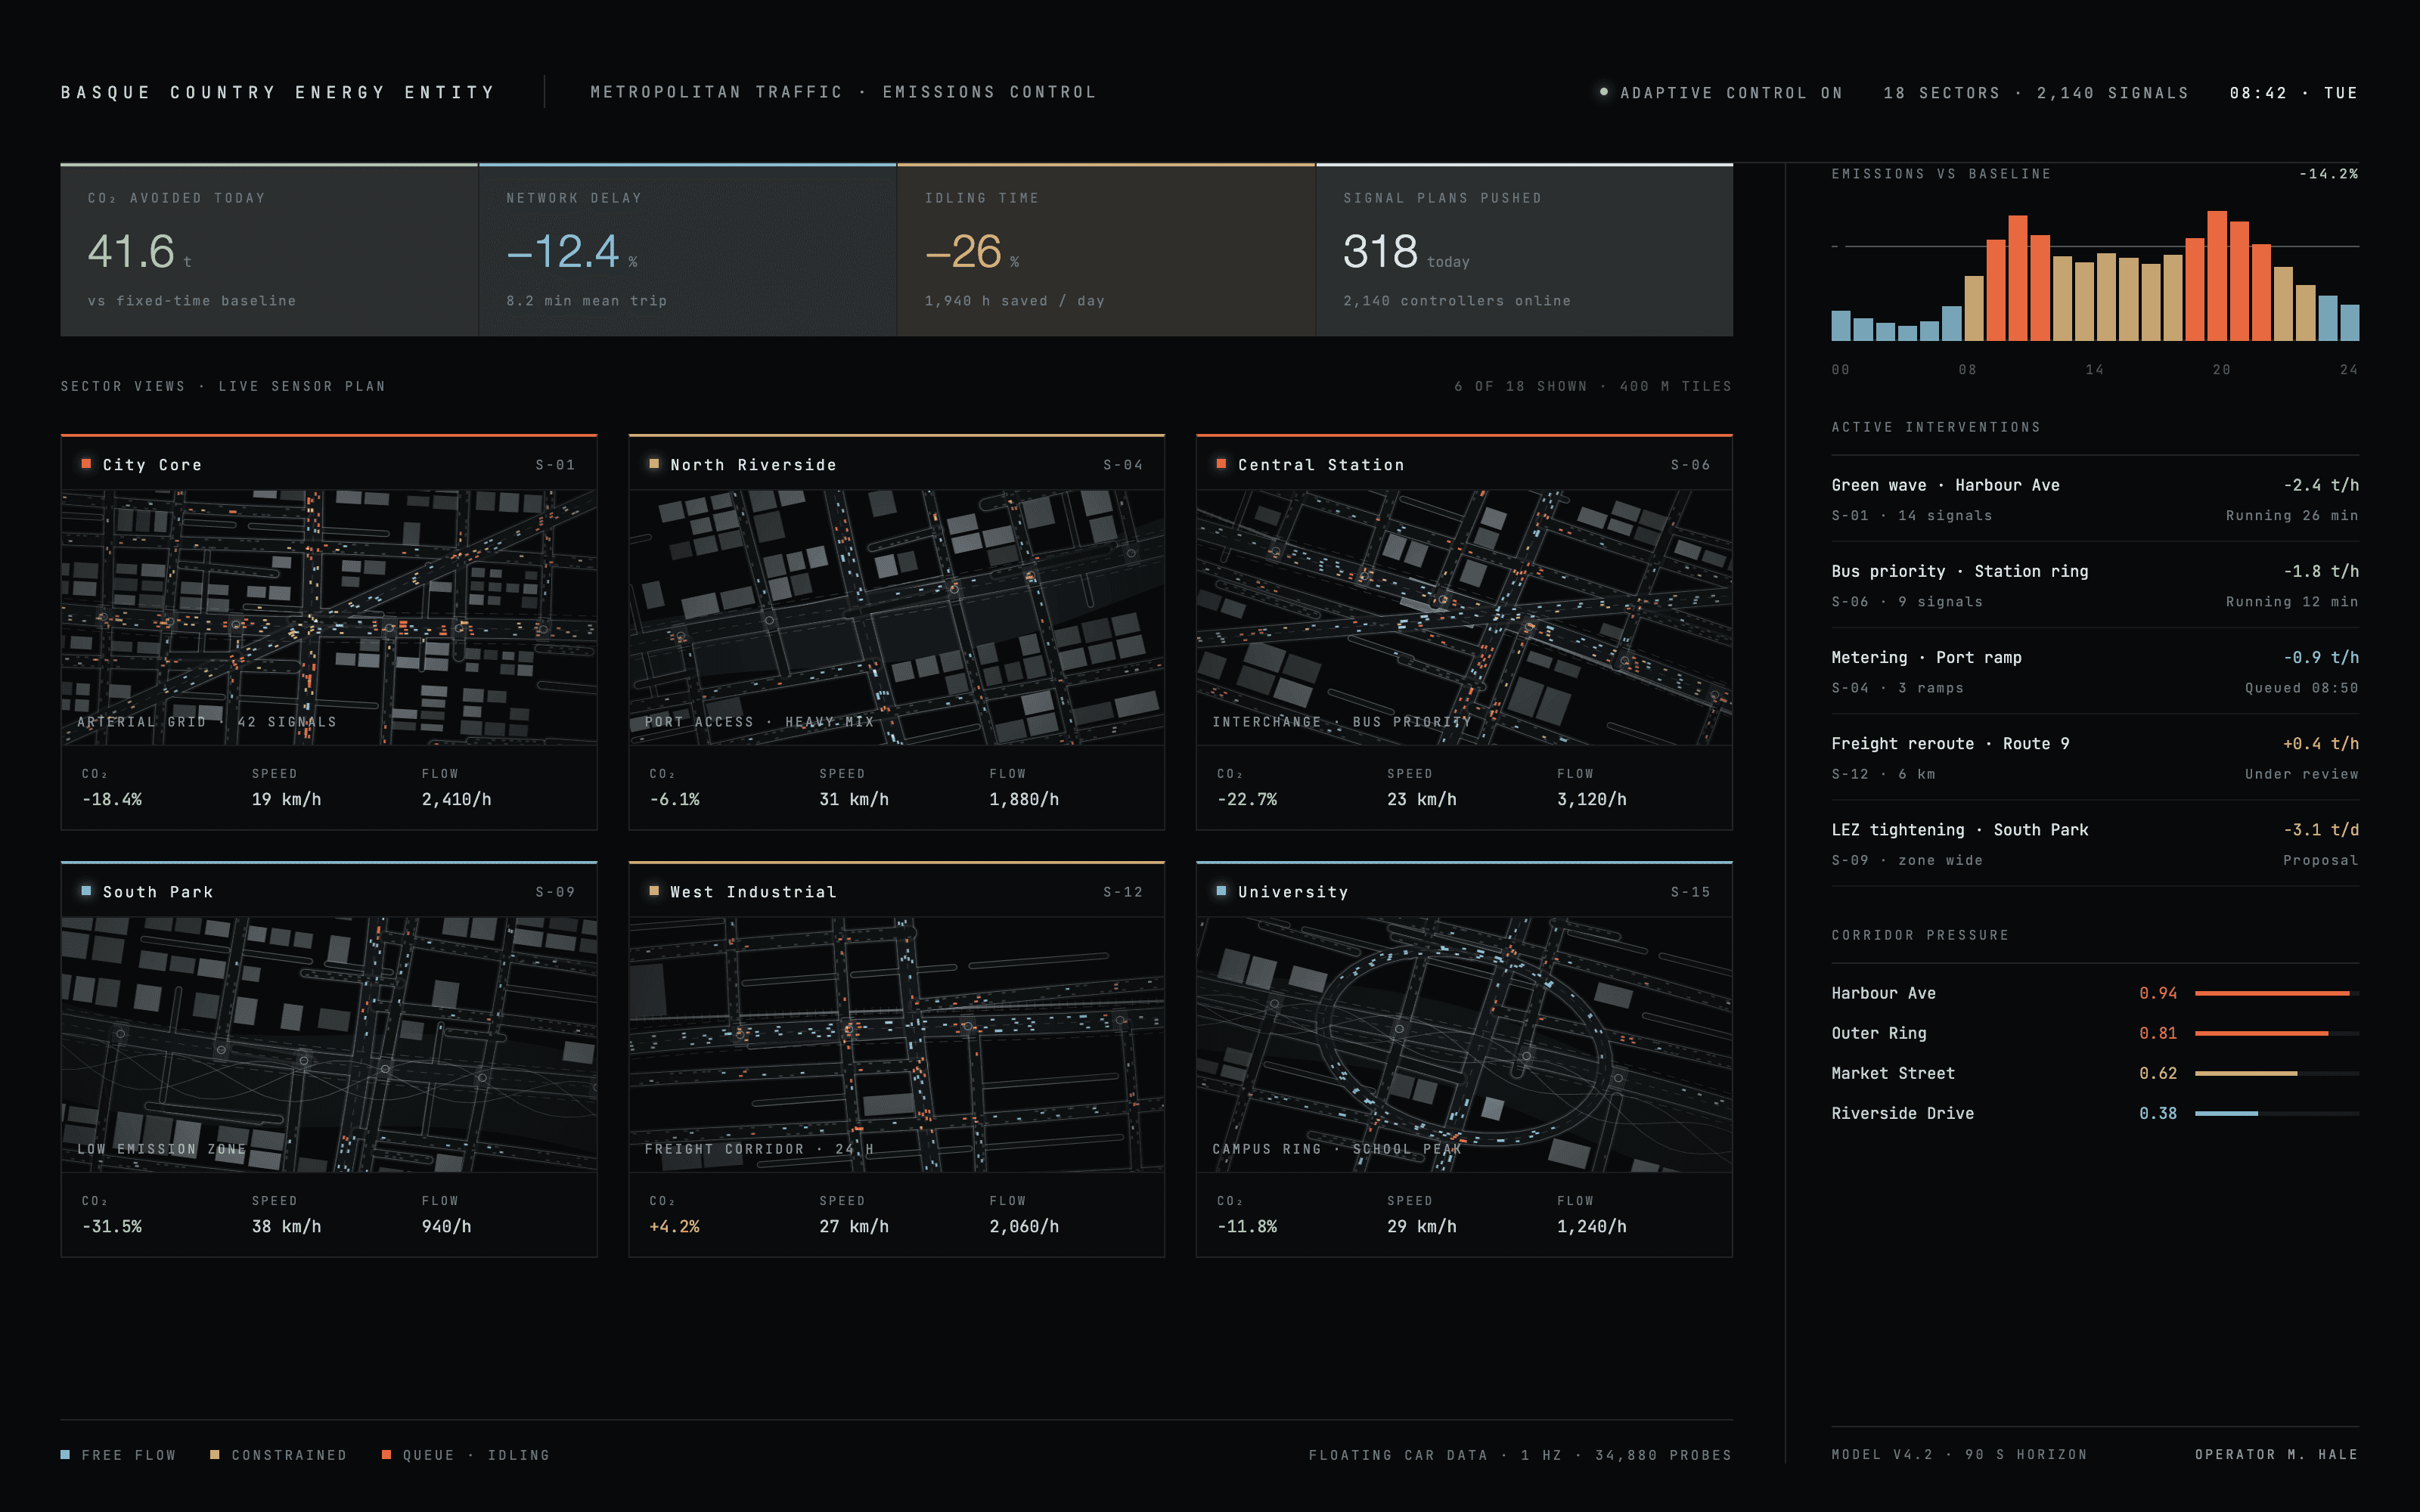
EVE engaged Woza to link urban traffic to emissions and bring them down through active management, after Woza's win in the BIND Innovation Program.

Client

EVE (Basque Energy Entity)

EVE (Basque Energy Entity)

Type

Operational model

Operational model

Sector

Public sector / Mobility

Public sector / Mobility

Region

Basque Country

Basque Country

Selected via

BIND Innovation Program

BIND Innovation Program

Dense forest canopy from above

Urban traffic corridor. Illustrative.

The challenge

Traditional traffic systems struggle with modern congestion. For EVE, that means rising CO2, inefficient flow and little real-time adaptation. Traffic, emissions and infrastructure data sit in separate places, and turning them into action is slow and resource-heavy.

Traditional traffic systems struggle with modern congestion. For EVE, that means rising CO2, inefficient flow and little real-time adaptation. Traffic, emissions and infrastructure data sit in separate places, and turning them into action is slow and resource-heavy.

Traditional traffic systems struggle with modern congestion. For EVE, that means rising CO2, inefficient flow and little real-time adaptation. Traffic, emissions and infrastructure data sit in separate places, and turning them into action is slow and resource-heavy.

The approach

A model that ties traffic to emissions, and an operational system that manages them down. Machine learning surfaces congestion before it forms, live sensor and GPS data map flow in real time, and optimized routing trims idle time. Dynamic signals respond automatically, and the same layer feeds planners toward greener city design.

A model that ties traffic to emissions, and an operational system that manages them down. Machine learning surfaces congestion before it forms, live sensor and GPS data map flow in real time, and optimized routing trims idle time. Dynamic signals respond automatically, and the same layer feeds planners toward greener city design.

A model that ties traffic to emissions, and an operational system that manages them down. Machine learning surfaces congestion before it forms, live sensor and GPS data map flow in real time, and optimized routing trims idle time. Dynamic signals respond automatically, and the same layer feeds planners toward greener city design.

The outcome

Run this way, the city eases congestion, cuts idle time and clears the air, without rebuilding its infrastructure. Managed traffic could become one of the cheapest levers a city has for its climate goals.

Run this way, the city eases congestion, cuts idle time and clears the air, without rebuilding its infrastructure. Managed traffic could become one of the cheapest levers a city has for its climate goals.

Run this way, the city eases congestion, cuts idle time and clears the air, without rebuilding its infrastructure. Managed traffic could become one of the cheapest levers a city has for its climate goals.

Biomass model output over a measured stand

Lower emissions

Advanced traffic systems can reduce CO2 in line with environmental goals.

Less congestion

Real-time, adaptive control can keep the city moving.

Cleaner air

Fewer emissions can mean measurable gains in wellbeing.

[ 11 ] // Under NDA

The public portfolio is intentionally incomplete.

The public portfolio is intentionally incomplete.

Some deployments support organizations where confidentiality is part of the engagement. The sectors can be shared. The engineering details require an NDA.

10 / 13

Energy Operator · Europe

Confidential

11 / 13

National Government · America

Confidential

12 / 13

Agriculture & Food · America

Confidential

13 / 13

Water & Climate · America

Confidential

[ 12 ] // Let’s build

Two ways to begin.

The Engine can enter your world two ways. One puts it to work inside the operation you run today. The other builds something your industry does not have yet.

The Engine

One engine, two ways to begin

An operation

An industry

One engine, two ways to begin

Path 01

Inside your operation

Put the Engine to work.

We bring the Engine into your operation and build the system your mission demands. It runs where your work happens, accountable to your outcomes, not to a slide deck.

For operators who need a system current engineering cannot build.

Path 02

Across your industry

Build what doesn’t exist yet.

We co-create the capability your industry is missing: a new operational system, a new product, sometimes a new company. When the Engine opens a category, we build the institution around it.

For leaders defining where their industry goes next.